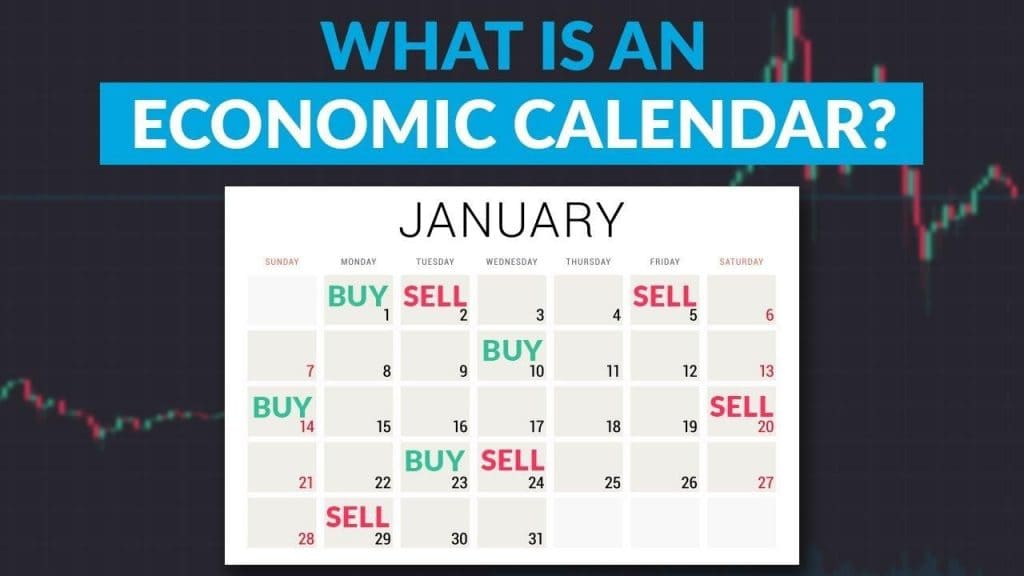
One of the trading tools traders need to be familiar with and look into every trading session is the Economic Calendar. But what exactly is an economic calendar?
An economic calendar is a list or chart of schedules of key figures or data releases of different countries that reflect their economic state or condition. Information about job employment rate, GDP growth, interest rates, and other significant figures are stipulated in an economic calendar. Several online news sites release Economic calendars for the public’s reference.
An economic calendar is an important tool that a trader needs to deal with since it reflects prices and figures indicating the health of a country’s economy as well as important economic activities that will take place in the near future.
Contents of the Economic Calendar
The economic calendar holds the most important updates and key economic indicators. Some of these indicators include:
Personal Income and Outlays
This particular report is issued regularly on a monthly basis. The figures containing this report represent the outlook of the consumers as well as the overall economic consumption. The values are measured in dollars. This report is regarded as the key indicator of where the economy is heading.
Producer Price Index
This indicator is a weighted price index that is measured at the wholesale level, not taking into account the import figures. This report signals the level of inflation and helps the market outlook.
Productivity report
The Productivity indicator determines the output level achieved by firms per labor unit, in connection with the Gross Domestic Product (GDP) and labor output numbers. This report aid investors in gauging and calculating figures easier.
Purchasing Manager Index (PMI)
The PMI is the major indicator among all monthly reports reflected in the economic calendar. This is because the figures yielded in this report are extracted from five other indicators, including the Production Level, Supplier Deliveries, New Orders, and Employment Level and Inventories. The 50 point benchmark indicates an expanding economy, while the 42-point mark is a sign of an economic recession.
How to Use the Economic Calendars
With a lot of things going on all at once, traders are faced with numerous figures and representations in the economic calendars. To determine which ones are more significant the others, each event is graded based on its level of significance or influence on the price movements in the markets.
Generally, market events with little to no significance are marked as “Low” level. Market events that may affect the prices are graded as the “Medium” level and are represented by a small yellow dot indicator. Market events carrying the most significance are graded as “High” levels and are represented by a red dot indicator.
Usually, traders plunge into the economic calendar first thing in the morning before going to the trading markets and take note of the market events with a “high” level of significance.
Economic calendars are produced in various formats and formats and represent a specific country and its upcoming events, as well as important updates and reports.

